Sample Report
This is what an RBHelix analysis looks like when it reaches you: a clear, professional report built from your data.
The sample report is created using demonstration data for a fictional store, Northstar Commerce. It does not belong to a real customer.
Report Preview
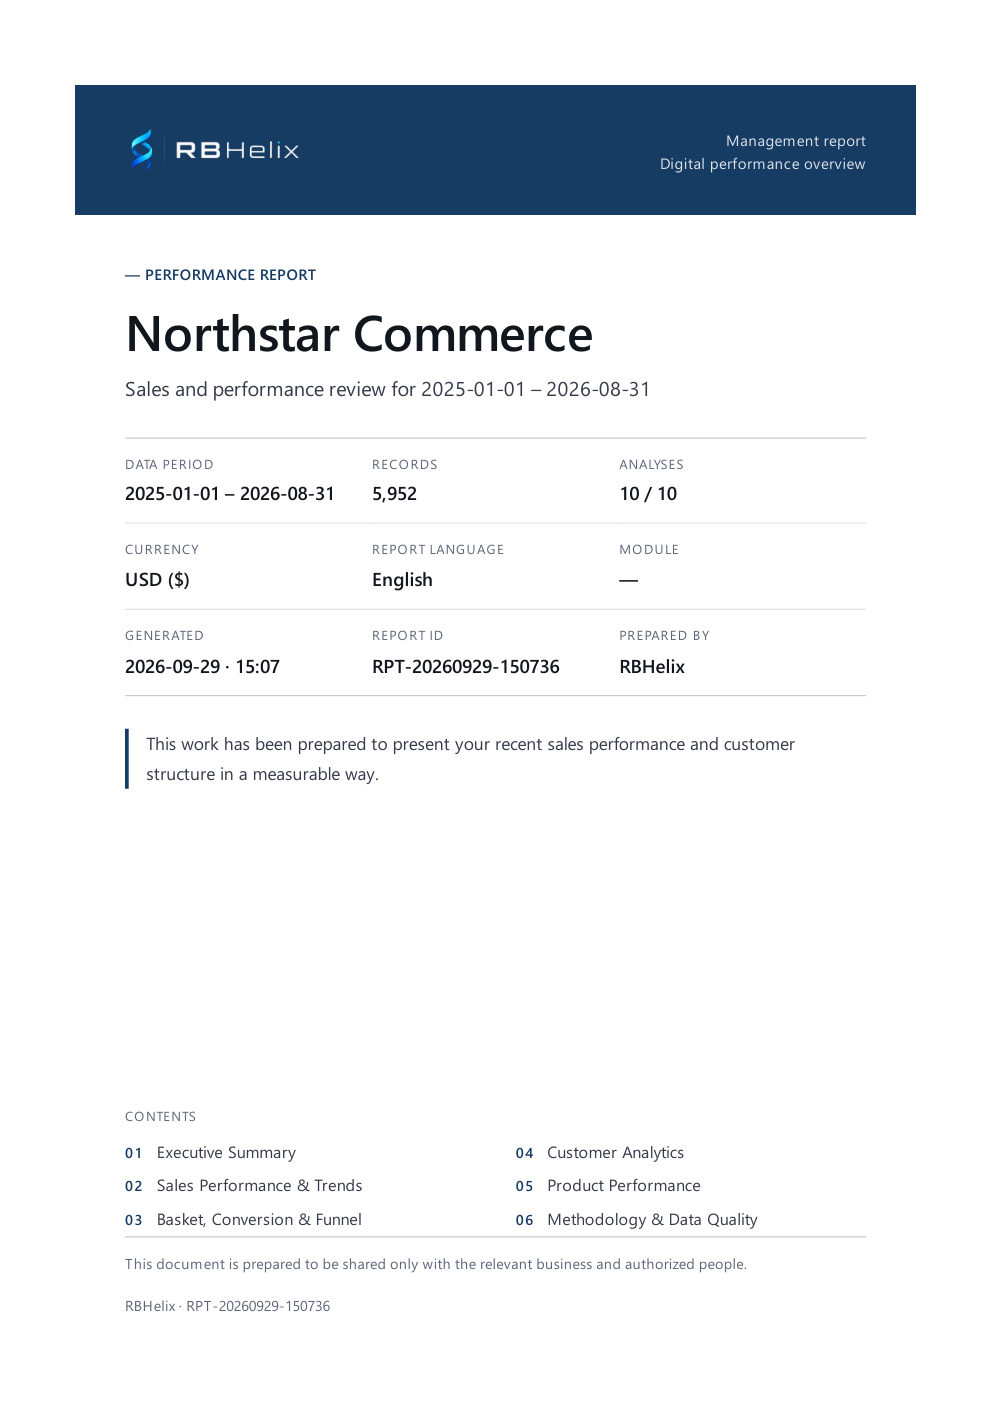
Selected pages from the sample report (English, demonstration data for January 2025 – August 2026). Open the PDF to see all 15 pages.
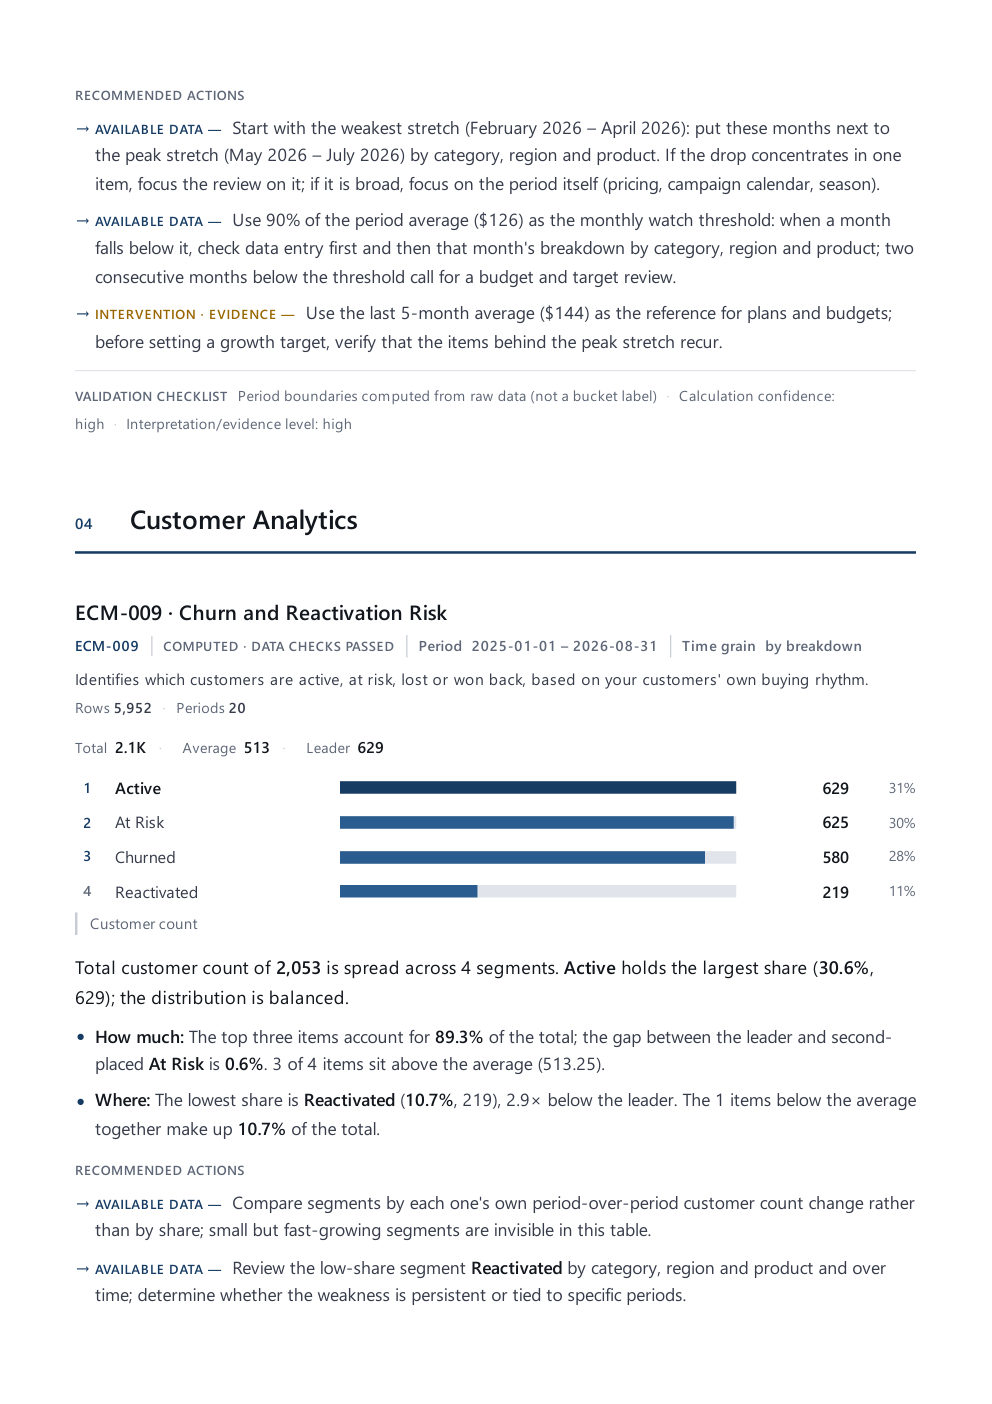
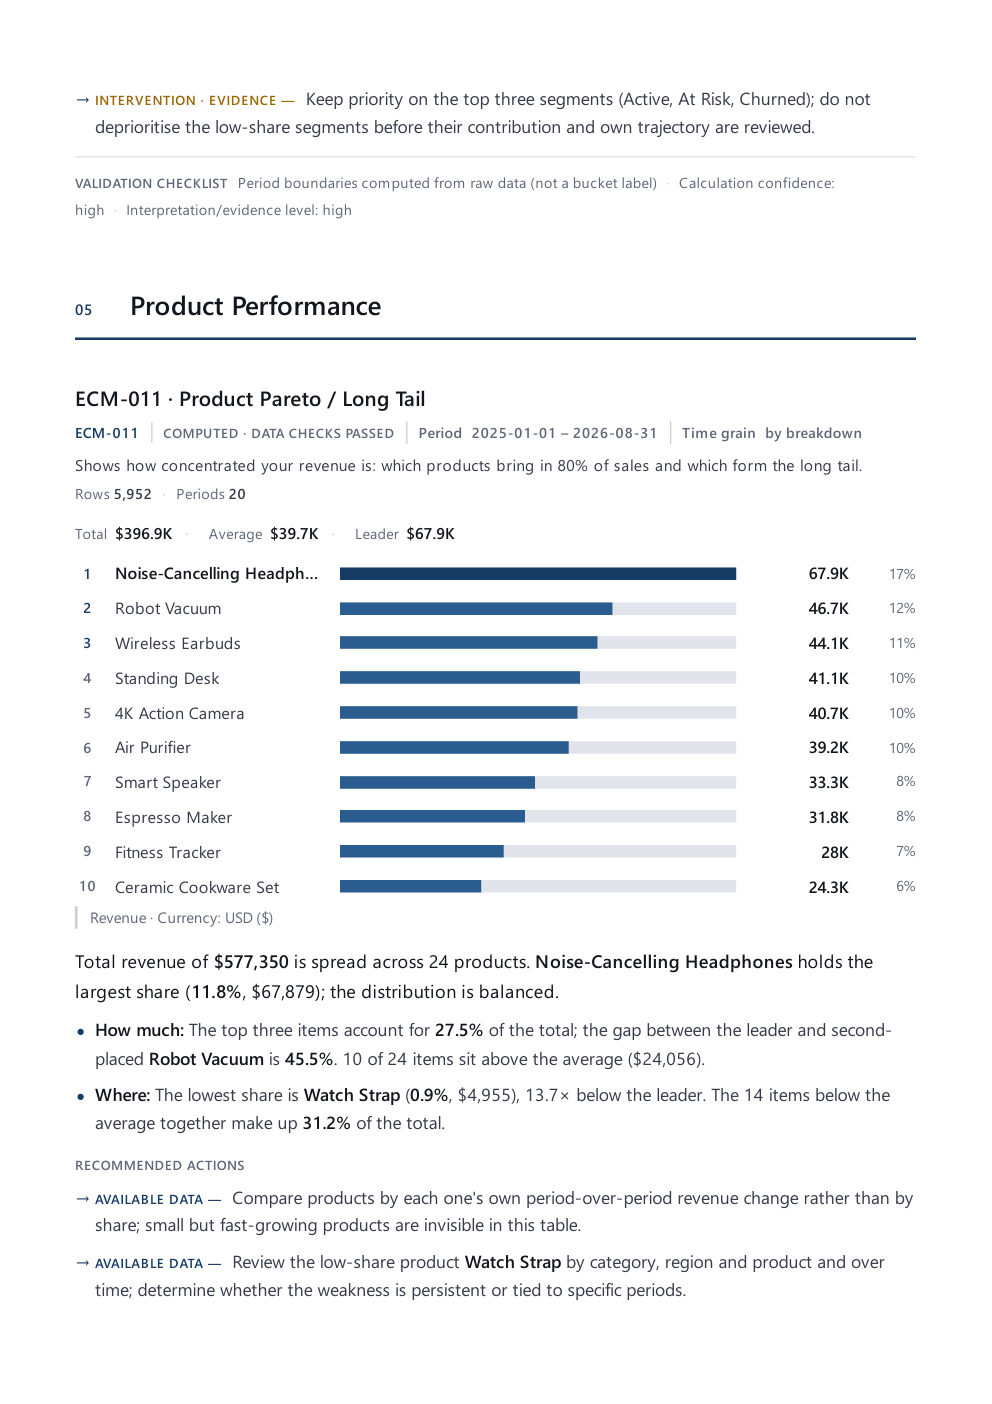
01
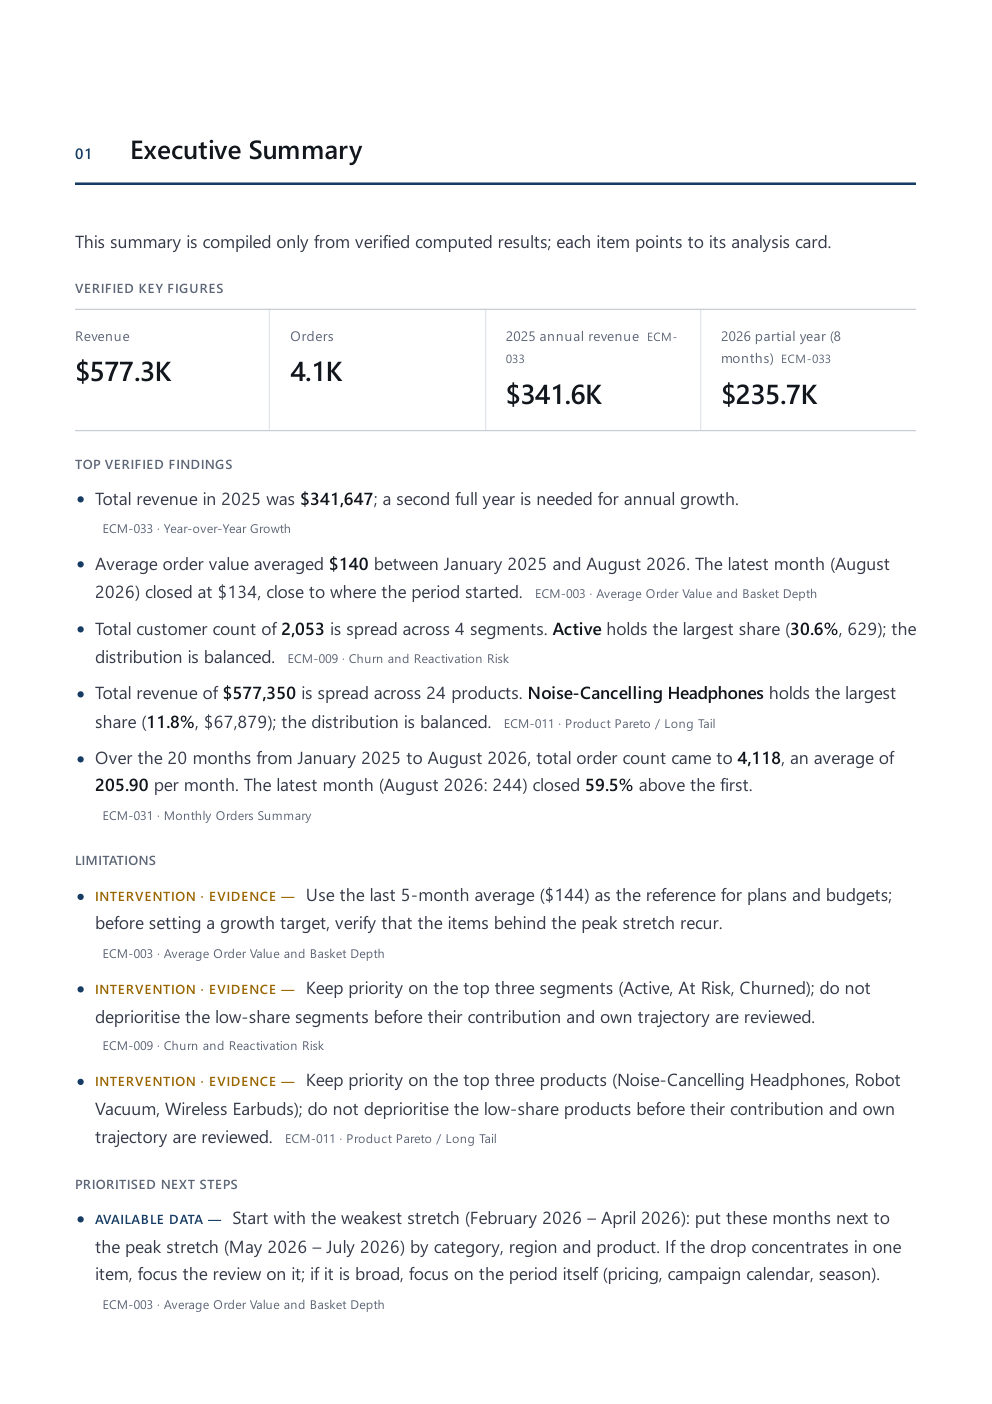
Executive Summary
The report opens with the key figures and the most important findings on one page, so the essentials are clear before the details.
02
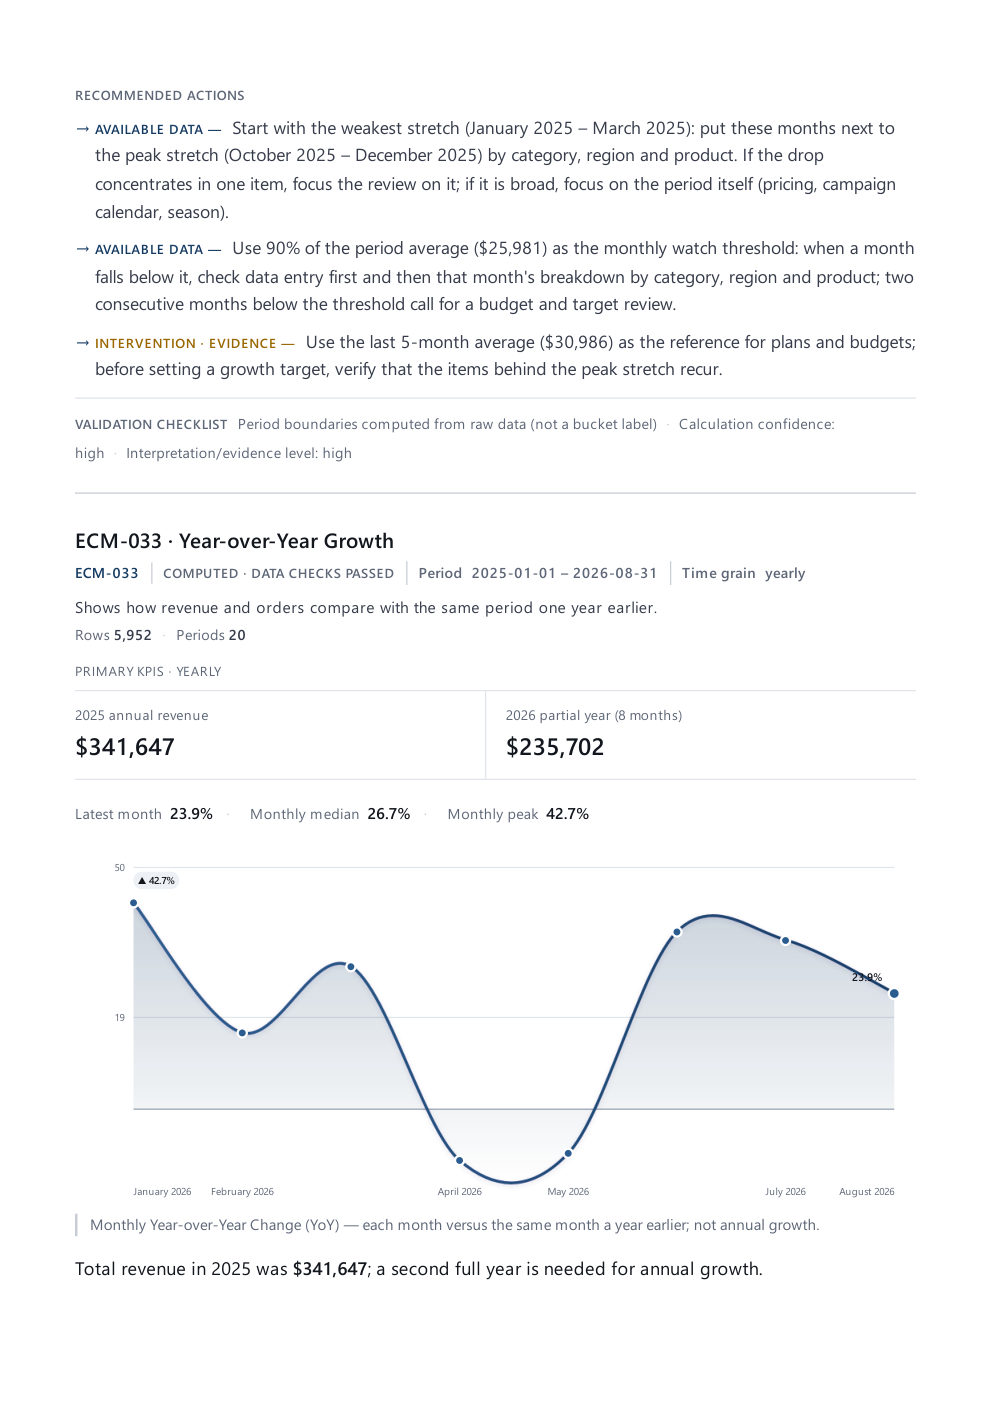
Key Performance Indicators
Each analysis presents its main indicators with the period, the data basis and a plain-language reading of what changed.
03
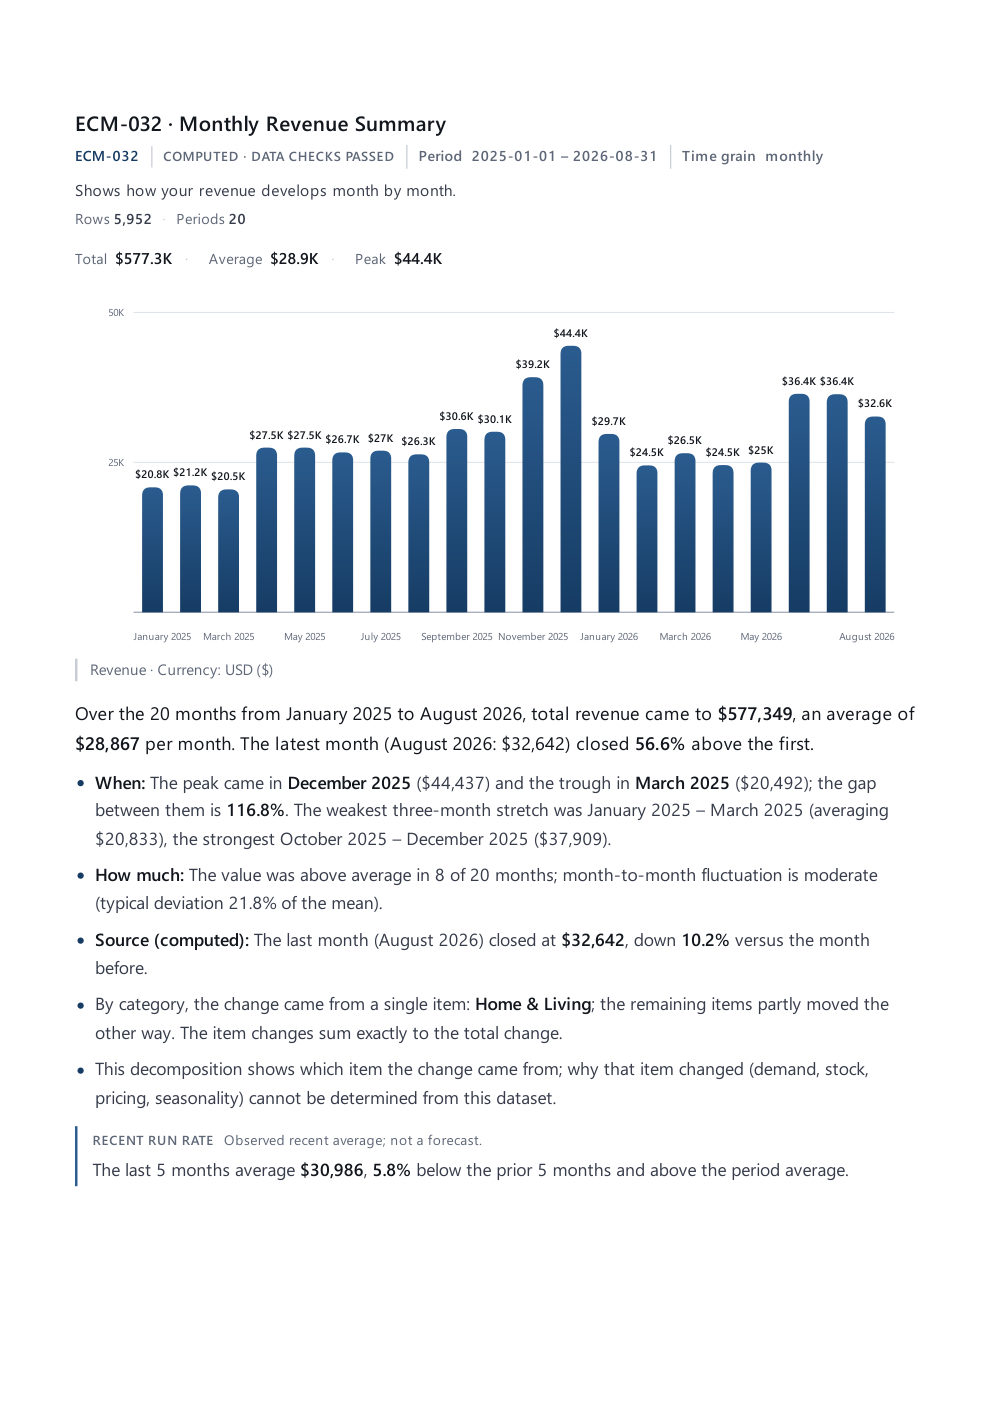
Charts & Trends
Trends are shown with clean charts that highlight peaks, declines and the latest position.
04
Key Findings
Important findings are written as short statements with the numbers behind them, so they can be read and checked quickly.
05
Risks & Opportunities
Potential problems are marked by severity and opportunities are listed separately, so you know where to look first.
06
Recommendations
Findings are followed by prioritized next steps that say what to review, compare or change, and why.
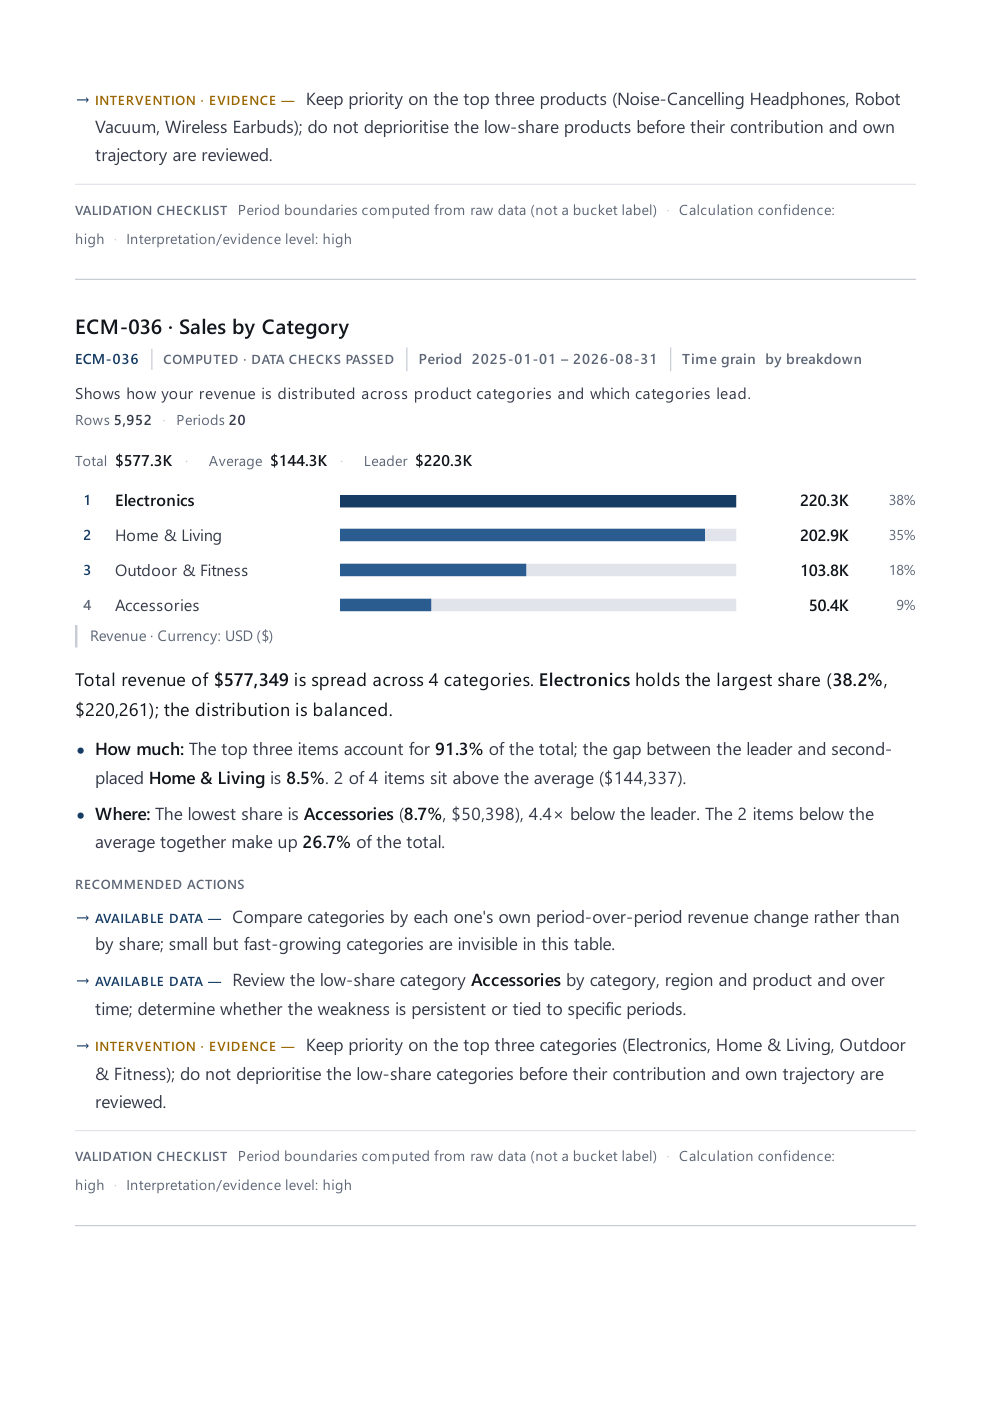
The sample report is created using demonstration data for a fictional store, Northstar Commerce. It does not belong to a real customer.
Want a Report Like This for Your Business?
Start a 7-day free trial and upload your data.